Application of RSI Indicator in Cryptocurrency markets
What”s the RSI Indicator?
Relative Strength Index(RSI) is a technical analysis tool first introduced by J. Welles Wilder Jr. in 1978. Main goal is to evaluate recent price changes and help traders identify potential overbought or oversold zones in chart.
RSI runs within a scale from to 0 to 100, reflecting the strength of recent gains compared to losses over a chosen period, which is usually 14 days.
RSI Calculation and Formula
Formula is :
RSI = 100 − 100 / (1 + RS)
• RS (Relative Strength) = Average Gain over N periods / Average Loss over N periods (N is typically 14).
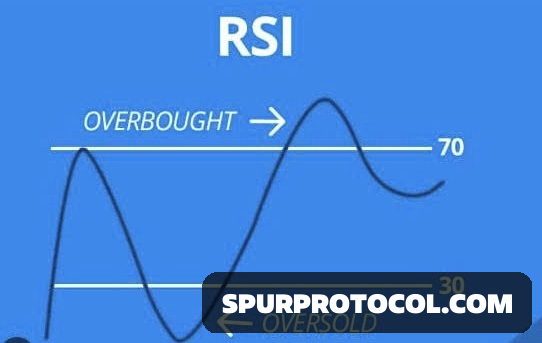
• RSI > 70: Indicates an overbought condition, suggesting a possible price pullback.
• RSI < 30: Indicates an oversold condition, signaling a possible price rebound.
• RSI between 30 and 70: Considered a neutral range; level 50 is often seen as a mid-point or no-trend line.
RSI only focuses on a single asset’s price strength over time.
Significance of RSI in Cryptocurrency markets
Identify Overbought or Oversold States:
o When RSI is above 70, it suggests that prices might be peaking and could soon decline.
o When RSI is below 30, it implies prices may have bottomed out and could rise.
Predicting on Trend Direction:
o If RSI moves above 50 (or breaks past 55 from a previous range), it often points to an uptrend.
o If RSI drops below 50 (or falls under 45), it can signal a potential downtrend.
Divergence Analysis:
o Bearish divergence: Price makes new highs, but RSI makes lower highs — a possible early warning of a reversal downward.
o Bullish divergence: Price makes new lows, but RSI makes higher lows — indicating potential for an upward reversal.
o Convergence may suggest that the current trend is likely to continue.
Applications of RSI
Method 1-Multi-Timeframe RSI
• Check RSI on a higher timeframe (e.g., daily chart).
o If RSI < 30: Watch for a possible upward reversal; look for buying opportunities.
o If RSI > 70: Watch for a possible downward reversal; consider selling.
• Use a lower timeframe (e.g., 4-hour chart) to find precise entry points.
Method 2- Confirm on Trend First
• First, determine the overall trend on a higher timeframe.
• Enter on a lower timeframe when RSI aligns (RSI > 70 for sell setups, RSI < 30 for buys).
Method 3-connect to SMA
• When SMA 30 crosses above SMA 100 and RSI is above 50 → Consider a buy.
• When SMA 30 crosses below SMA 100 and RSI is below 50 → Consider a sell.
Method 4- Combine to Bollinger Bands
• Price touches the lower band and RSI is oversold → Possible buy signal.
• Price touches the upper band and RSI is overbought → Possible sell signal.
This combination helps filter out false signals and improves overall accuracy.
Method 5 -Failure Swing
• Wait for RSI to reach an extreme zone and then break its previous swing point before entering.
Method 6- Combine to Reversal Candlestick Patterns
• Let RSI enter an extreme zone and then look for reversal candlestick signals (e.g., hammer, shooting star) to confirm before entering a trade.
Method 7- Divergence Trading:
• Bullish divergence: Price forms is lower lows while RSI forms higher lows → Possible buy.
• Bearish divergence: Price makes higher highs while RSI makes lower highs → Possible sell.
• Hidden divergences can also support trend continuation setups.
Notes:
• RSI isn’t perfect; prices can stay above 70 or below 30 for longer than expected.
• Reversal signals can vary depending on timeframe and market volatility.
• Always look for extra confirmation before acting on RSI alone.
• RSI works best when combined to other technical tools to create a stronger, more reliable strategy.
SUMMARY
RSI is a respected indicator cryptocurrency markets. For beginners, learning how to step by step and connect it with other strategies can greatly improve and confidence in trading all your decisions. Good Luck.