Crypto Candles For Beginners: Reading The Market With Ease
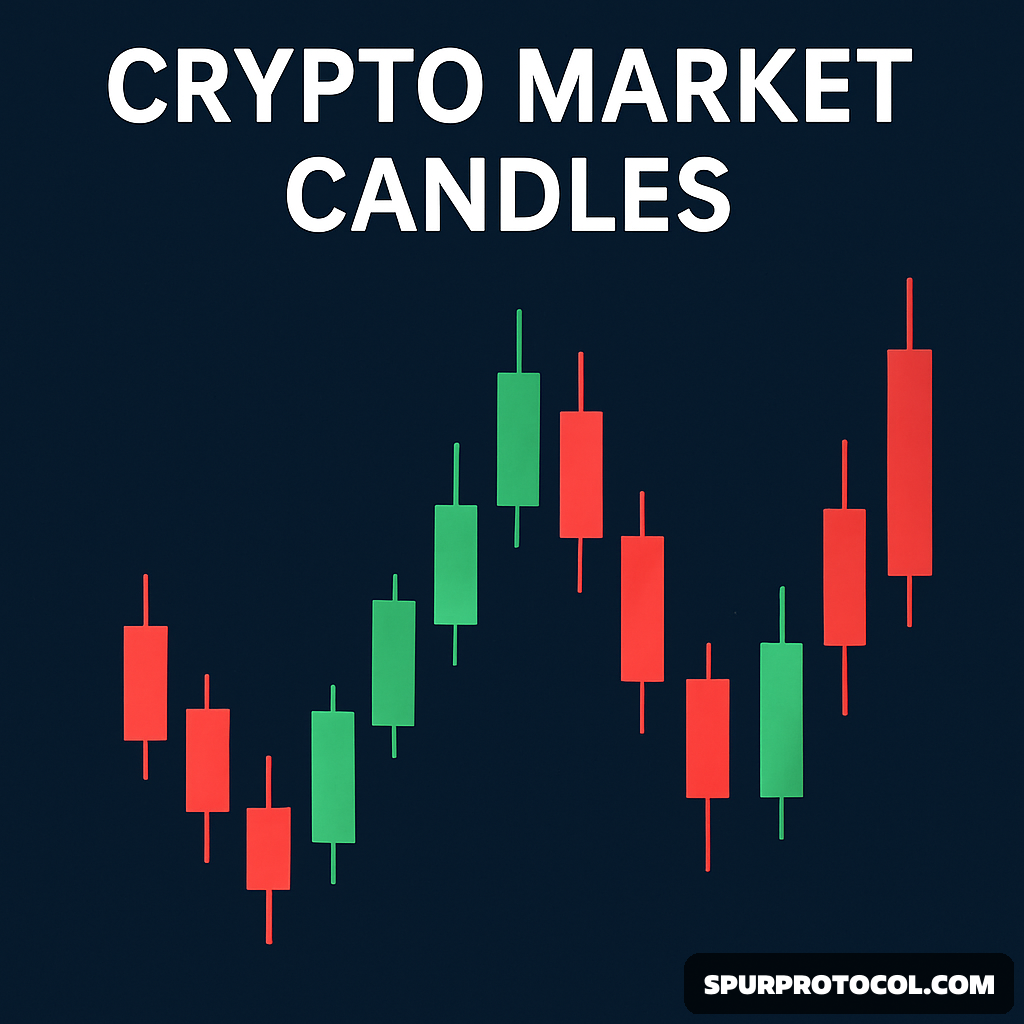
In crypto trading, candlestick charts help beginners understand how prices move. Each candle shows how much the price of a coin changed in a set time—like 1 hour or 1 day. A green candle means the price went up, while a red one means it went down. The “body” of the candle shows the opening and closing prices, and the “wicks” show the highest and lowest prices during that time.
Go Back
🕒 3:33 PM
📅 May 03, 2025
✍️ By Emeralddd
Crypto candles (or candlesticks) are like story-tellers for traders. Each one shows what happened to a coin’s price during a specific period—could be 1 minute, 1 hour, 1 day, etc.
Here’s how it works:
Green candle = price went up
Red candle = price went down
Thick part (the body) = the price it started and ended at
Thin lines (wicks or shadows) = the highest and lowest prices reached during that time
So, if you see a green candle with a long body, it means buyers were strong and pushed the price up. A red one with a long top wick? Maybe buyers tried, but sellers won.
Traders look at these candles in patterns—like doji, hammer, or engulfing—to guess what might happen next. It's not magic, but it helps!
Some popular candlesticks patterns and what they usually mean for crypto traders:
1. Doji
Looks like: A plus sign or cross (very small body, long wicks).
Meaning: Indecision—buyers and sellers are in a standoff. Could signal a reversal if it appears after a strong trend.
2. Hammer
Looks like: Small body on top, long lower wick.
Meaning: Bullish reversal—sellers pushed the price down, but buyers fought back. Seen after a downtrend.
3. Inverted Hammer
Looks like: Small body at the bottom, long upper wick.
Meaning: Bullish signal, often after a downtrend—buyers are gaining strength.
4. Shooting Star
Looks like: Opposite of inverted hammer—appears after an uptrend.
Meaning: Bearish reversal—buyers pushed up but sellers slammed it down.
5. Bullish Engulfing
Looks like: A small red candle followed by a big green one that engulfs it.
Meaning: Strong bullish signal—buyers are taking over.
6. Bearish Engulfing
Looks like: A small green candle followed by a big red one that engulfs it.
Meaning: Strong bearish signal—sellers are gaining power.
Yes, market candles are very crucial in the