Differences Between Demand And Supply, And Support And Resistance Levels In Crypto And Forex Trading
In crypto and forex trading, demand and supply drive market prices. When demand exceeds supply, prices rise, and when supply exceeds demand, prices fall.
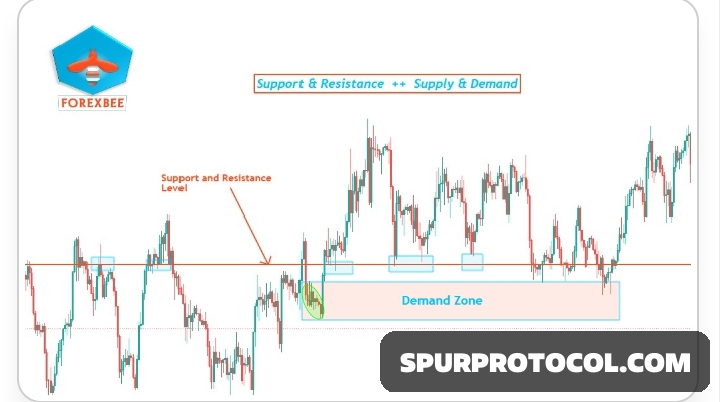
Support and resistance levels are key price points where buying or selling interest is strong, helping traders identify potential entry and exit points.
Go Back
🕒 6:49 AM
📅 Aug 01, 2025
✍️ By MattCapability
DEMAND AND SUPPLY
In both crypto and forex trading, the price of an asset is determined by the forces of demand and supply. Here's a simple breakdown:
• DEMAND: This refers to the desire and ability of buyers to purchase an asset at various price levels. When demand is high, prices tend to rise because more buyers are willing to pay higher prices.
• SUPPLY: This refers to the amount of an asset that sellers are willing to offer at various price levels. When supply is high, prices tend to fall because there are more sellers than buyers.
SUPPORT AND RESISTANCE LEVELS
Support and resistance levels are key concepts in technical analysis used to identify potential price reversal points. Here's how they work:
• SUPPORT LEVEL: This is a price level where the demand for an asset is strong enough to prevent the price from falling further. Traders see this level as a good buying opportunity, increasing demand and helping to stabilize the price. If the price falls to the support level and bounces back up, it confirms the support level.
• RESISTANCE LEVEL: This is a price level where the supply of an asset is strong enough to prevent the price from rising further. Traders see this level as a good selling opportunity, increasing supply and preventing further price increases. If the price rises to the resistance level and falls back down, it confirms the resistance level.
KEY DIFFERENCES
• Demand and Supply are fundamental concepts that drive price movements based on market participants' actions. They are the underlying forces that create support and resistance levels.
• Support and Resistance Levels are technical indicators that help traders identify potential price reversal points. They are based on historical price data and market psychology.
PRACTICAL APPLICATION
• IDENTIFYING SUPPORT AND RESISTANCE: Traders often use historical price data to identify support and resistance levels. These levels can be horizontal lines (static support/resistance) or trendlines (dynamic support/resistance).
• TRADING STRATEGIES: Traders use these levels to place buy or sell orders. For example, a trader might place a buy order near a support level, expecting the price to bounce back up, or a sell order near a resistance level, expecting the price to fall.
EXAMPLE
In crypto trading, if Bitcoin's price has historically bounced back up from 30,000, traders might identify 30,000 as a support level. Conversely, if the price has repeatedly failed to break above 40,000, traders might identify40,000 as a resistance level.
In forex trading, if the EUR/USD pair has consistently found buying interest at 1.1000, traders might consider 1.1000 as a support level. If the pair has struggled to break above 1.2000, traders might consider 1.2000 as a resistance level.
Understanding these concepts can help you make more informed trading decisions and manage risk more effectively.