Fibonacci Retracement: The Trader’s Secret Weapon For Spotting Reversals
Fibonacci retracement helps traders understand—it’s a roadmap for spotting where price might take a breather before resuming its trend.
Go Back
🕒 6:20 PM
📅 Feb 28, 2025
✍️ By Pumpsquad
Ever watched a market climb like crazy, then suddenly pull back before continuing its run? It’s like a sprinter taking a quick break before pushing forward again. That little pause or dip is what Fibonaccci retracement helps traders understand—it’s a roadmap for spotting where price might take a breather before resuming its trend.
What is Fibonacci Retracement? (Without the Complicated Math)
Fibonacci retracement is a simple tool traders use to find potential support and resistance levels during a market pullback. It’s based on an ancient mathematical sequence
When a price moves up (or down), it doesn’t just go in a straight line forever. Instead, it retraces some of that move before continuing in the same direction. Fibonacci retracement levels mark how much of the previous move the price is likely to give back before bouncing again.. The key levels traders watch are:
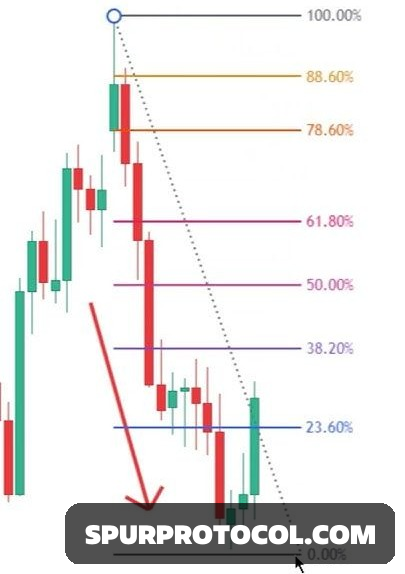
- 23.6% – A small pullback, trend still strong
- 38.2% – A common level for a quick bounce
- 50% – A deep but natural retracement before a continuation
- 61.8% – The famous "Golden Ratio," where big reversals often happen
- 78.6% – A deep retracement, but still possible for the trend to resume
Think of it like this: If you toss a ball up in the air, it won’t come straight down—it’ll slow down first, maybe hover a bit, then drop. Fibonacci levels act as those invisible markers showing where the price might "hover" before deciding its next move.
Why Do Traders Use Fibonacci Retracement?
Traders love Fibonacci retracement because it helps them make better decisions when entering and exiting trades. Here’s how it helps:
🚀 Predicts possible reversal zones – Instead of guessing where the price might bounce, you have clear levels to watch.
🚀 Confirms support & resistance – If price respects a Fibonacci level, it’s likely a strong area where buyers or sellers step in.
🚀 Widely used by traders – And because so many people watch these levels, they often become self-fulfilling (price reacts to them simply because everyone expects it to).
How to Use Fibonacci Retracement in Trading (Step-by-Step Guide)
1️. Find a strong move – Look for a clear uptrend or downtrend
2️. Apply the Fibonacci tool – Draw from the swing low to swing high (for an uptrend) or swing high to swing low (for a downtrend).
3️. Watch key levels – If the price pulls back to 38.2%, 50%, or 61.8%, check if it bounces or stalls—this could be your trade setup!
Real-Life Example: Imagine Climbing a Staircase
Think of the market like someone running up a staircase. They might sprint up 10 steps, but they pause for a second before running up the next set. That little pause? That’s Fibonacci retracement in action—it’s the market catching its breath before making its next big move.
Fibonacci retracement won’t guarantee a winning trade every time, but it’s one of the best tools for spotting where the market might turn. When combined with candlestick patterns, moving averagees, or trendlines, it becomes even more powerful.
Next time you see the market take a dip after a big move, check those Fibonacci levels—they might just show you where the next big opportunity is!