How To Trade The Dragonfly Doji
Dojis are known for signaling indecision in the market and some of them like the dragonfly Doji arej very important at certain positions on the chart, so let's find out how to interpret it before entering a trade
Go Back
🕒 6:32 PM
📅 Jul 11, 2025
✍️ By BrigxelBiz
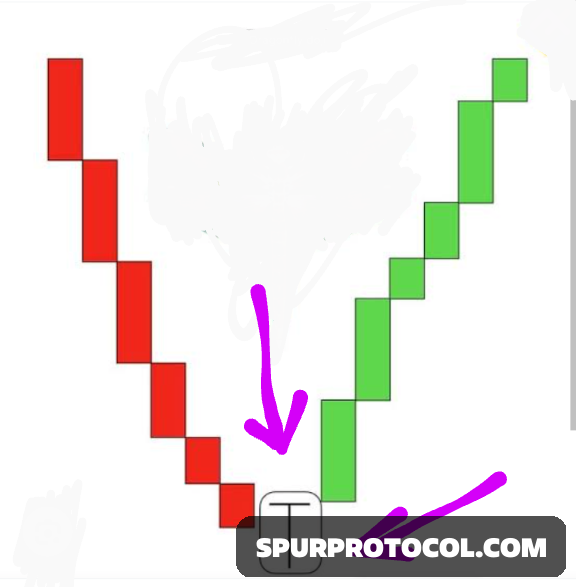
This is a Japanese candlestick pattern. It looks like a dragonfly in shape or the letter ‘T’. It has a long lower shadow and typically has no upper shadow. It has a small body because the open and close price are approximately the same or even equal.
It signals a possible change in trend when it appears at the end of a downtrend. It is a strong reversal signal at this position and it causes bullish sentiments.
Although it is a bullish signal as explained above, it can also appear at the end of a long uptrend and in this case, signals a decline in momentum from buyers and may lead to a drop in price.
It can also appear in a consolidating market trend. that is; when the market swings sideways in a channel before breaking out to continue upwards.
So, how do we trade this Doji?, the easiest method is to long when it shows up at the end of a downtrend and place a stop loss properly or maybe ensure your risk management strategy is engaged, but more skilled traders don't just jump in, they seek agreement with other signals. They use It in confluence with other confirmations like RSI, high section volume and more before longing.
Finally, don't forget that it might not work sometimes. It might give false signals so it gives a stronger signal when it shows up after a prolonged downtrend especially when the bears are exhausted and lack the momentum to keep driving the market downwards. So make sure to use It in confluence with other confirmations.
Personally, in addition to a high section volume and RSI confirmations, I would also wait for the next candle to form and close above the open or close of this Doji before trading.
Thanks for reading and seeing you in my next lesson.