How To Use Technical Indicator: ADX
How to Use Technical Indicator: ADX
Go Back
🕒 4:50 AM
📅 Jul 12, 2025
✍️ By CRYPTOBNF2
What is ADX Indicator?
ADX is calculated using +DM, -DM, and TR for a default of 14 days period.
ADX is a technical indicator used in trading that measures the DIRECTION and STRENGTH of a particular trend.
ADX Indicator Strategy
ADX consists of 3 components:
ADX Line
+ DI and
- DI
When +DI is above -DI, it indicates bulls are stronger than bears
When -DI is above +DI, it indicates bears are stronger than bulls
When ADX Line is above 20, indicates the trend is strong
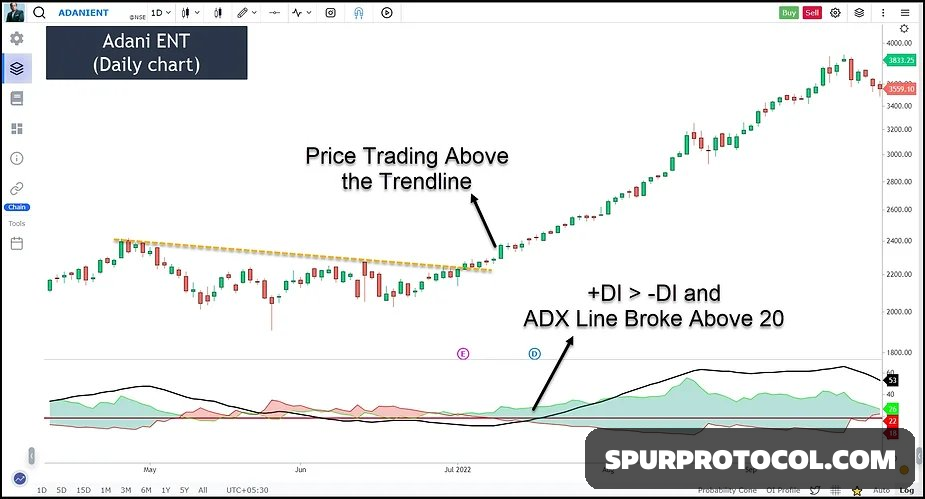
ADX Trade Plan (Long)
Entry:
+DI line is > -DI line & ADX Lines crosses 20
or
ADX line is above 20 & +DI line crosses -DI line from the downside
Entry should come above the high of the candle
SL - Below the low of the entry candle
Target - Next swing high or TSL
ADX Trade Plan (Short)
Entry:
-DI line is > +DI line, and ADX Lines cross 20
or
ADX line is above 20 & -DI line crosses +DI line from the downside
Entry should come above the low of the candle
SL - Above the high of the entry candle
Target - Next swing low or TSL
ADX in Intraday Trading
PDH - stands for Previous Day's High
PDL - stands for Previous Day's Low
IB High - Initial Balance High (First 1-hour high after market open)
IB Low - Initial Balance Low (First 1-hour low after market open)
Long Trade:
Entry: When The price breaks PDH or IB High + ADX line is above 20 & +DI is above -DI
Stop-loss: Below the low of the entry candle
Exit: Target any next resistance zone or TSL
Short Trade:
Entry: When The price breaks PDL or IB Low + ADX line is above 20 & -DI is above +DI
Stop-loss: Above the high of the entry candle
Exit: Target any next support zone or TSL