Technical Indicator: The Ichimoku Cloud
Technical Indicator: The Ichimoku Cloud
Go Back
🕒 1:32 PM
📅 Jul 14, 2025
✍️ By CRYPTOBNF2
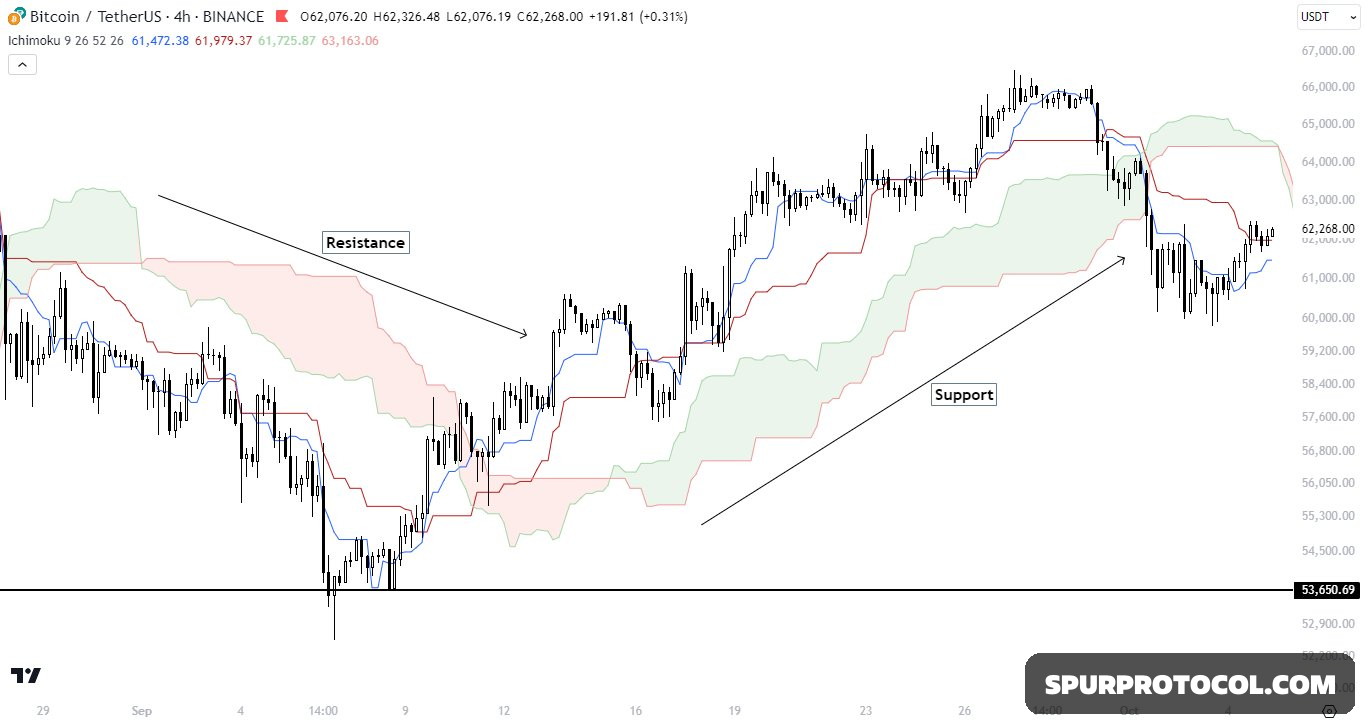
Ichimoku Cloud
The Ichimoku Cloud is a collection of technical indicators that show support and resistance levels, as well as momentum and trend direction.
It also uses these figures to compute a “cloud” where the price may find support or resistance in the future.
“It is the combination of different indicators”.
It tells us:
Different types of moving averages which overlap with each other.
Support and Resistance.
Momentum either it is bullish or bearish.
Trend of the market.
It is composed of 5 Lines
Tenkan Sen (Conversion Line): It is blue in colour. Kind of fast moving average.
Kijun Sen (Base Line): It is red in colour. It works as a trend line.
Chikou Span (Lagging Span): It is green in colour. It tells us how much lag is there in the market and price volatility.
Kumo Clouds: There are two clouds (Green and Red).
Span A (Green) and Span B (Red): Which act as major areas of support and resistance.
What is the best time frame?
For scalpers/intra day traders: 5 minute-1 hour
For Swing Trading: From 4 Hour to 1 Day Time Frame
Strategy on how to take a long position.
Tenkan Sen crossing Kijun Sen upside, bullish signal.
Strategy on how to take a short position
When Tenkan Sen crosses the Kijun Sen downside, bearish signal.
Filter the signal received through Lagging Span
Lagging Signal: This line indicates the big picture of the trend. The evolution of the current price action in relation to previous price action.
Don’t take the trade when the candles are inside the cloud.