The History And Anatomy Of Candlesticks
Many people find candlesticks patterns very necessary for their trading strategies and some traders even depend on them entirely but did you know that the history of candlesticks is traceable to rice traders in the 18th century in Japan who developed it to track the movement of the price of rice in the market.
Go Back

🕒 5:06 AM
📅 Jun 02, 2025
✍️ By BrigxelBiz
Let's Begin 😂
A particular man known as Munehisa Homma, a Japanese also was using them to make trading decisions in the rice market and his strategies formed the foundation for the charting strategies we use nowadays in technical analysis and for this, he is generally recognised today for the earliest use of candlesticks.
The credit doesn't go to Homma alone, the global market uses candlesticks to trade different assets like stocks, cryptocurrencies, gold and many others, but this would not have been possible without the efforts of an American technical analyst by name; Steve Nison who penned down this style of trading in a book he entitled: “Japanese Candlestick Charting Techniques” and today, it has become an important tool that many use to navigate the financial market.
So what really is a candlestick?
As hinted earlier when we talked about the Japanese rice merchants, it is used to track price movements caused by the buying and selling action of traders over a specific time interval. A candlestick can either have a red or green colour. A red candlestick shows that the cumulative impact of selling and buying by traders in any market over a period of time was in favour of the sellers. This signals a temporary victory by sellers. While a green candlestick shows that the cumulative impact or effect of the buying and selling action of traders in the market over a certain period of time was in favour of the buyers.
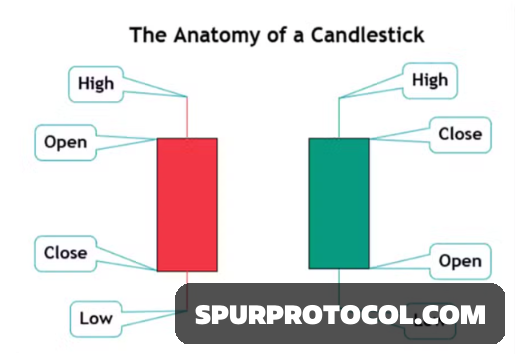
So let's now look at the anatomy of both candles.
They both have open prices, close prices, lows, highs, bodies and wicks. The wicks, if present, stick out of the body and the ends of these wicks or shadows signal the lowest and highest prices recorded over a given time frame or interval. The significant difference between a red candlestick which represents the bears or sellers in the market and a green candlestick which represents the bulls in the market is that the red candlestick opens above and closes below while a green candlestick opens below and closes above.
We shall draw the curtains here but in our next episode, we shall look at the deeper psychology behind the formation of these candlesticks.
