Trading Strategies With The Ichimoku Cloud In Cryptocurrency Market
Trading Strategies with the Ichimoku Cloud in Cryptocurrency market
Description
The Ichimoku Cloud strategy is a technical analysis method that uses a collection of indicators to provide traders with signals about potential prices movements, support and resistance levels, and overall market trends. It's a versatile tool, but it's important to understand its components and how they interact to form trading signals.
Go Back
🕒 4:22 AM
📅 Jul 08, 2025
✍️ By lan78
Trading Strategies with the Ichimoku Cloud in Cryptocurrency market
Description
The Ichimoku Cloud strategy is a technical analysis method that uses a collection of indicators to provide traders with signals about potential prices movements, support and resistance levels, and overall market trends. It's a versatile tool, but it's important to understand its components and how they interact to form trading signals.
Key Components:
• Tenkan-sen (Conversion Line):
A short-term trend indicator, typically calculated as the average of the highest high and lowest low over the last 9 periods.
• Kijun-sen (Base Line):
A medium-term trend indicator, usually calculated as the average of the highest high and lowest low over the last 26 periods.
• Senkou Span A (Leading Span A):
Calculated by averaging the Tenkan-sen and Kijun-sen and plotting it 26 periods into the future. This forms one edge of the cloud.
• Senkou Span B (Leading Span B):
Calculated by averaging the highest high and lowest low over the last 52 periods and plotting it 26 periods into the future.
• Chikou Span (Lagging Span):
The current period's closing price plotted 26 periods behind.
• Kumo (Cloud):
The area between Senkou Span A and Senkou Span B. The cloud's color and position relative to price action are important for identifying potential support and resistance zones
Trading strategies with the Ichimoku Cloud:
1. Trend Following:
• Uptrend:
Price is above the cloud, and the cloud is green (Senkou Span A is above Senkou Span B). Traders look for pullbacks to the cloud as potential buying opportunities.
• Downtrend:
Price is below the cloud, and the cloud is red (Senkou Span A is below Senkou Span B). Traders look for rallies into the cloud as potential selling opportunities.
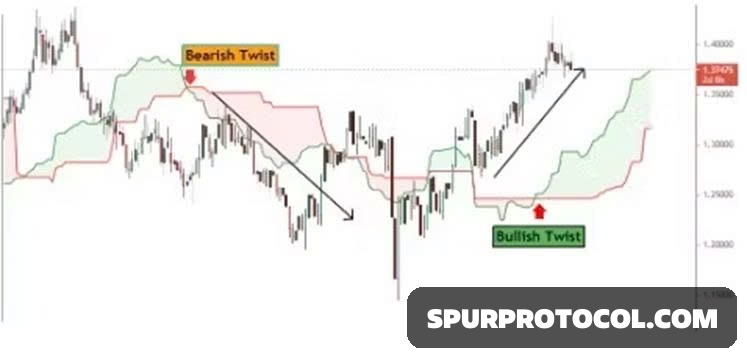
2. Crossover Signals:
• Tenkan-sen / Kijun-sen Crossovers: A bullish crossover (Tenkan-sen crosses above Kijun-sen) suggests upward momentum, especially if it occurs above the cloud. A bearish crossover (Tenkan-sen crosses below Kijun-sen) suggests downward momentum, especially if it occurs below the cloud.
• Cloud Breakouts: When price breaks above or below the cloud, it can signal a potential trend change. A breakout above the cloud is a bullish signal, and a breakout below is bearish.
3. Support and Resistance zones:
• Cloud as Support/Resistance: The cloud itself can act as dynamic support and resistance levels.
• Senkou Span as Support/Resistance: The Senkou Span lines (A and B) can also act as support and resistance levels.
4. Chikou Span:
• Confirmation: The Chikou Span can be used to confirm the strength of a trend.
For example, a bullish signal is stronger when the Chikou Span is above the price action.
Important Considerations:
• Timeframe:
The Ichimoku Cloud is generally more effective on longer timeframes (e.g., daily, weekly).
• Confirmation:
It's wise to confirm Ichimoku signals with other indicators or price action analysis.
• Risk Management:
Always use stop-loss orders and proper risk management techniques when trading with the Ichimoku Cloud.
• Backtesting:
Thoroughly backtest any Ichimoku strategy before using it with real money.
Summary
The Ichimoku Cloud indicator may seem complicated at first look, but once a trader is aware of what each of the components represents and how to use them,They can be a useful tool as it displays a variety of information which reduces the need for more indicators.