What is a Double Bottom?
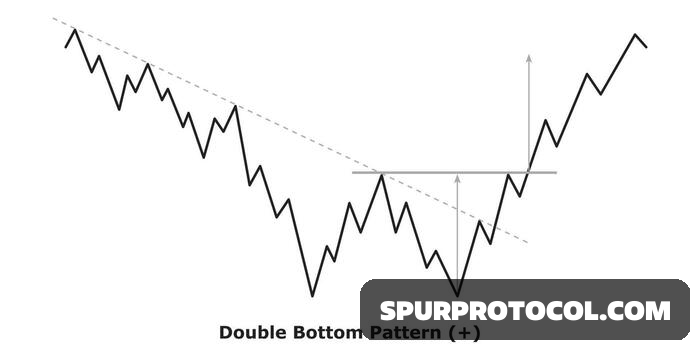
A Double Bottom is a classic bullish reversal chart pattern that looks like the letter "W". It signals that a prolonged downtrend is likely exhausting and a reversal to an uptrend is beginning.
* The Psychology: The price drops to a low point (first bottom), where sellers are exhausted and buyers step in, causing a bounce. The price then falls again, but the buyers defend the same general price area (second bottom), confirming that the selling pressure is no longer strong enough to push the price lower. This failure to make a lower low is the key signal. The final confirmation is when the price breaks above the peak between the two bottoms.
Step-by-Step Guide to Trading the Double Bottom
Step 1: Identify the Pattern Correctly
A valid double bottom has specific characteristics. Don't force a "W" shape where there isn't one.
1. Preceding Downtrend: The pattern must occur after a clear and sustained downtrend.
2. Two Distinct Bottoms: The two lows should be roughly equal in price. They don't have to be identical; a slightly higher second bottom is actually a stronger bullish signal.
3. The Neckline (Confirmation Level): This is the peak (the highest point) between the two bottoms. It acts as the key resistance level.
4. Volume: Ideally, volume should be higher on the decline into the first bottom and diminish on the decline into the second bottom. The most critical volume surge should occur when the price breaks above the neckline.
Step 2: Plan Your Entry, Stop-Loss, and Take-Profit
The key to profitable trading is having a plan before you enter.
1. Entry (The Trigger):
* Conservative Entry: Place a buy order after the price closes above the neckline resistance. This is the safest confirmation that the reversal is likely genuine.
* Aggressive Entry: Some traders buy on the bounce from the second bottom, anticipating the breakout. This offers a better price but carries a higher risk of the pattern failing.
2. Stop-Loss (Managing Risk):
* Your stop-loss should always be placed below the second bottom. This is your admission that the pattern has failed if the price makes a new low.
* Why below the second bottom? The entire thesis is that the second bottom is a level of strong support. If that level breaks, the downtrend is likely resuming.
3. Take-Profit (Securing Gains):
* The most common method is to measure the pattern's height.
* Height: Calculate the distance from the neckline to the bottom of the troughs.
* Profit Target: Project this distance upward from the point of the neckline breakout.
* Example: If the neckline is at `$50,000` and the bottoms are at `$45,000`, the height is `$5,000`. Your profit target would be `$50,000 + $5,000 = $55,000`.
A Concrete Trading Example (Bitcoin)
Let's assume Bitcoin has been in a downtrend.
1. Identification:
* BTC drops to `$40,000` and bounces to `$44,000` (neckline).
* It then falls back to `$40,100` (forming a slightly higher low) and bounces again. You now see a "W" shape.
2. Entry:
* You wait for the price to break and close decisively above the `$44,000` neckline.
* You enter a long position at `$44,200`.
3. Stop-Loss:
* You place your stop-loss at `$39,800`, safely below the second bottom at `$40,100`.
4. Take-Profit:
* Pattern Height: `$44,000 - $40,000 = $4,000`.
* Profit Target: `$44,000 + $4,000 = $48,000`.
Your Risk/Reward Ratio: You are risking `$44,200 - $39,800 = $4,400` to make a potential `$48,000 - $44,200 = $3,800`. This is a nearly 1:1 ratio, which is acceptable for a high-probability setup.
Crucial Tips for Crypto Markets
* Confirm with Higher Timeframes: A double bottom on the 4-hour or daily chart is far more reliable than one on a 5-minute chart. Always check the higher timeframe trend.
* Use Other Indicators for Confirmation: Don't rely on the pattern alone. Strengthen your thesis with:
* RSI Divergence: The RSI indicator might make a higher low on the second bottom while the price makes an equal low. This is a strong bullish divergence.
* Significant Volume Spike: The breakout above the neckline should have a clear and strong volume increase.
* Support from a Major Level: If the double bottom forms at a key historical support level or a major moving average (like the 200-day EMA), it adds significant credibility.
* Beware of False Breakouts: Crypto is notorious for "wicks" and fakeouts. Wait for a candle close above the neckline, not just a wick that taps it.
* Manage Your Position:** Consider taking partial profits at your target (e.g., 50% of your position) and letting the rest run with a trailing stop-loss if the trend remains strong.
Summary
The double bottom is a reliable tool, but it is not a crystal ball. Success comes from:
1. Correctly identifying the "W" pattern after a downtrend.
2. Patiently waiting for the neckline breakout confirmation.
3. Meticulously managing your risk with a stop-loss below the second bottom.
4. Taking profits logically using the measured move target.
By following this disciplined approach, you can effectively use the double bottom pattern to catch significant trend reversals in the cryptocurrency market.