As act like dynamic support/resistance.
→ Price often bounces off key MAs like 50, 100, and 200.
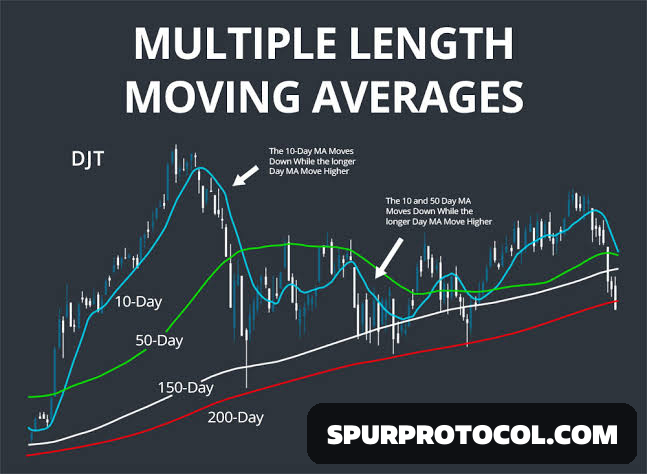
Shorter MAs react faster, but give more false signals.
→ Use 5–13 MA for entries, but confirm with structure.
Crossovers signal momentum shifts.
→ Golden Cross = Bullish (50 MA crosses above 200 MA)
→ Death Cross = Bearish (50 MA drops below 200 MA)
Tight MA clusters = explosive moves coming.
→ When 5-8-13 MAs compress, expect breakout soon.
Pullbacks to long-term MAs are high-probability zones.
→ Smart money often reloads near the 100 or 200 MA.
Use MAs with price action, not blindly.
→ Always check structure, volume, and context.
Rising MAs = uptrend. Falling MAs = downtrend.
→ Helps you avoid trading against the tide.
The steeper the MA slope, the stronger the trend.
→ Flat MAs = choppy, avoid overtrading.
Master the rhythm of MAs and you'll never feel lost in a trend again