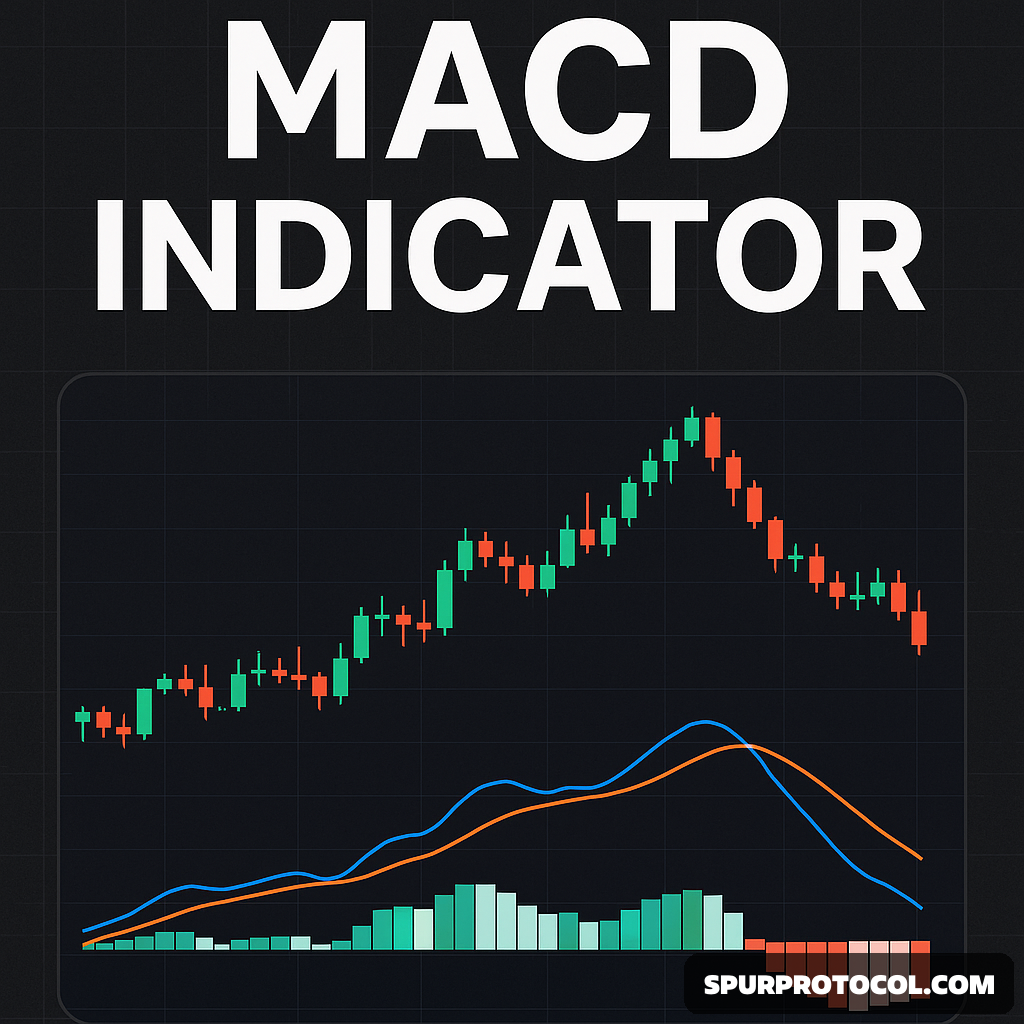
Understanding The MACD Indicator
All you need to know about the MACD Indicator.
Go Back

🕒 9:11 AM
📅 May 29, 2025
✍️ By Inside_Life247
The Moving Average Convergence Divergence (MACD) is a momentum-based trend-following indicator that highlights the relationship between two exponential moving averages (EMAs) of an asset's price. Developed by Gerald Appel in the late 1970s, it has become a staple in technical analysis.
Understanding MACD
MACD is calculated by subtracting the 26-period EMA from the 12-period EMA, resulting in the MACD line. A 9-day EMA of this MACD line—known as the signal line—is then plotted alongside it. This signal line helps traders spot potential buy or sell opportunities.
A histogram is also typically shown with the MACD. It represents the difference between the MACD line and the signal line. When the MACD is above the signal line, the histogram appears above the baseline (positive), and when it’s below, the histogram is under the baseline (negative).
MACD helps in the following ways:
Momentum Insight: When MACD nears the zero line, it signals that the two EMAs are converging.
Trend Direction: A MACD above zero indicates bullish momentum; below zero suggests bearish momentum.
Strength of Momentum: Greater distance from the zero line reflects stronger momentum; less distance implies weaker momentum.
Trading with MACD
There are several common strategies for using MACD in trading:
1. Crossovers
A bullish signal happens when the MACD line crosses above the signal line.
A bearish signal forms when it drops below the signal line.
Example: Traders might buy when MACD crosses above the signal line and sell when it crosses below.
2. Overbought and Oversold Signals
Though MACD has no set limits, extreme moves well above or below zero can indicate overbought or oversold conditions.
A high MACD may point to an overbought asset, while a deep drop below zero could signal an oversold one.
3. Divergence
Divergence between price and MACD may indicate a potential trend reversal.
Bullish divergence: Price hits a lower low while MACD forms a higher low—suggesting weakening downward momentum.
Bearish divergence: Price hits a higher high while MACD fails to follow—suggesting a weakening uptrend.
4. Zero-Line Crossovers
A move above the zero line (bullish crossover) indicates the 12-day EMA has overtaken the 26-day EMA.
A drop below the zero line (bearish crossover) suggests the opposite.
The zero line can also act as a dynamic support or resistance level.
While MACD is a powerful technical tool, it's not infallible. For more reliable signals, it's best to use it alongside other technical indicators and analysis methods.

