Understanding The RSI INDICATOR
Ublnderstanding the RSI INDICATOR
Go Back
🕒 6:35 PM
📅 May 28, 2025
✍️ By Inside_Life247
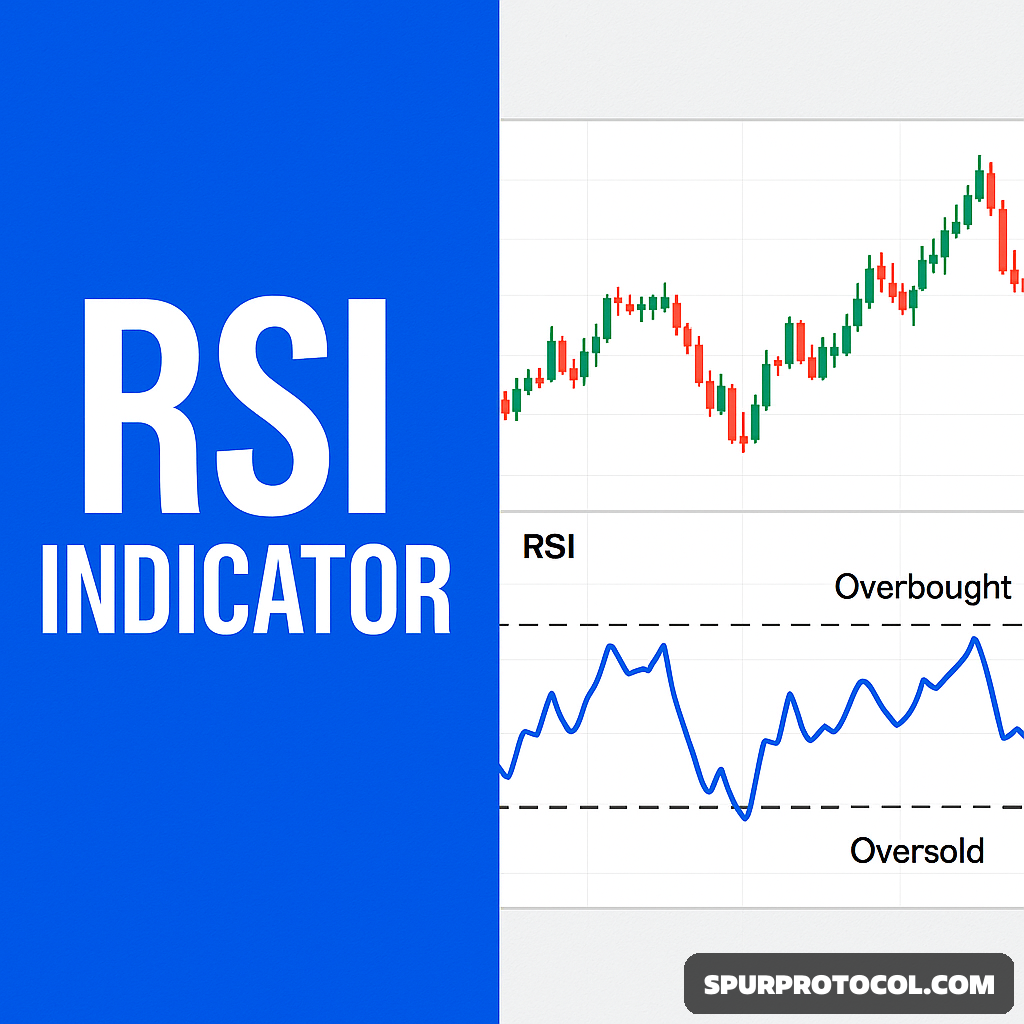
Relative Strength Index (RSI)
The Relative Strength Index, or RSI, is a momentum-based technical indicator developed by J. Welles Wilder and introduced in his 1978 book New Concepts in Technical Trading Systems. This tool measures the velocity and magnitude of price movements, providing values between 0 and 100. It's widely used to detect whether an asset is potentially overbought or oversold.
What It Does and Indicates
RSI evaluates the strength of a security’s recent price performance to signal when prices may have moved too far in one direction—either up (overbought) or down (oversold).
The formula for RSI is:
RSI = 100 - (100 / (1 + RS)),
where RS = Average gain over 'n' periods / Average loss over 'n' periods.
The standard setting for 'n' is 14 periods, which can be applied to different timeframes like daily, weekly, or intraday charts.
RSI values range from 0 to 100. In general:
An RSI above 70 may indicate an overbought condition and a possible price pullback.
An RSI below 30 may indicate an oversold condition and a potential price rebound.
How to Use RSI in Trading
RSI can be applied in various strategies:
Overbought/Oversold Levels: The most straightforward use of RSI is to look for buy signals when the RSI is below 30 (oversold) and sell signals when it's above 70 (overbought). However, it's important to note that these levels don’t guarantee immediate reversals.
Example: A stock with an RSI of 78 may be seen as overbought, potentially signaling a coming price decline.
Divergence: When RSI and price move in opposite directions, it may suggest a shift in momentum. A bullish divergence occurs when the price hits a new low but RSI forms a higher low, hinting at a possible upward reversal. A bearish divergence happens when price hits a new high but RSI forms a lower high, possibly signaling a downward move.
Example: If a stock's price falls to a new low while RSI makes a higher low, it could indicate a weakening downtrend and an upcoming reversal.
Trendlines and Breakouts: Traders often draw trendlines on the RSI itself. A breakout above or below these trendlines can act as a signal for a change in momentum.
Example: If RSI breaks above a downward trendline, it might indicate a bullish shift.
Centerline Cross: The 50 level acts as a midpoint. When RSI moves above 50, it can indicate bullish momentum; dropping below 50 can suggest bearish momentum.
Example: If RSI rises from 45 to 55, it crosses above the centerline, pointing to growing bullish strength.
RSI in Practice
This information is provided solely for educational purposes and should not be considered financial or trading advice. Always consult a professional financial advisor before making investment decisions. Use this data at your own discretion.
