UNDERSTANDING VOLUME INDICATOR
The price reaction in volume analysis
Go Back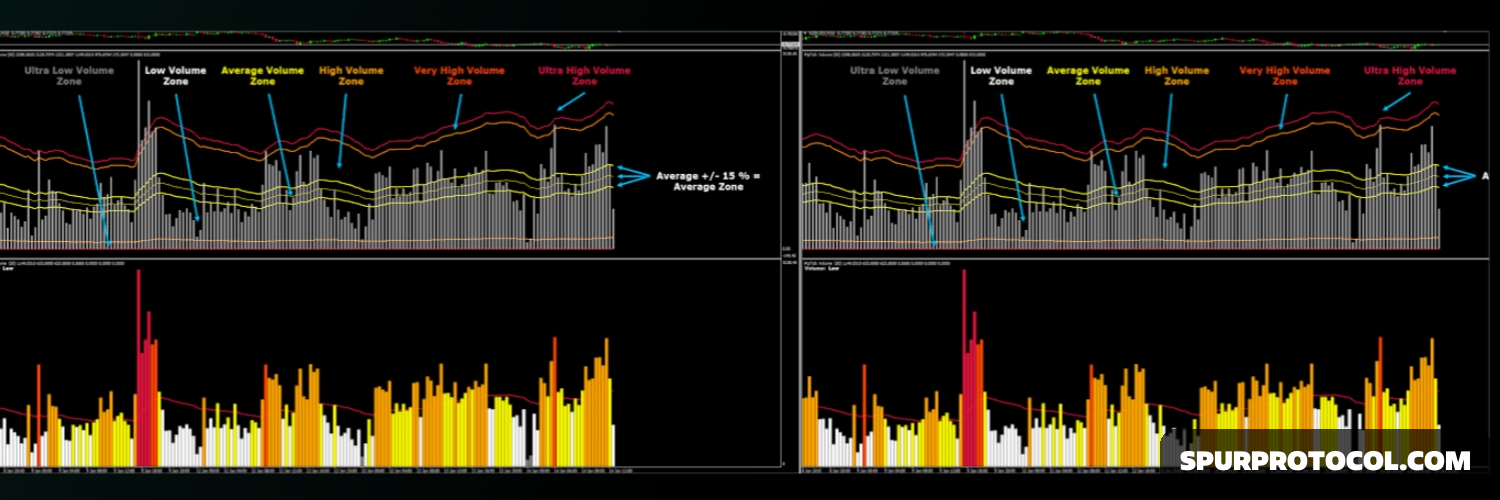
🕒 3:50 AM
📅 Jun 13, 2025
✍️ By moseseli600
The price reaction in volume analysis
Go Back
🕒 3:50 AM
📅 Jun 13, 2025
✍️ By moseseli600
Volume indicators are a crucial tool in cryptocurrency trading, providing valuable insights into market direction and price dynamics. By analyzing volume patterns, traders can gain a better understanding of market sentiment, confirm trends, and identify potential reversals.
1. Confirming Trends: Volume indicators can confirm the strength of a trend. A rising price with increasing volume indicates a strong uptrend, while a falling price with increasing volume indicates a strong downtrend.
2. Identifying Reversals: Volume indicators can also identify potential reversals. A decrease in volume during a trend may indicate a weakening trend, while an increase in volume during a consolidation phase may indicate a potential breakout.
3. Improving Trading Decisions: By analyzing volume patterns, traders can make more informed trading decisions, such as entering or exiting a trade, setting stop-loss orders, or adjusting position sizes.
1. False Signals: Volume indicators can generate false signals, especially in volatile markets. Traders should use volume indicators in conjunction with other technical analysis tools to confirm trading signals.
2. Lagging Nature: Volume indicators can be lagging, meaning they may not reflect current market conditions. Traders should use volume indicators in combination with leading indicators to get a more comprehensive view of the market.
3. Market Manipulation: Volume indicators can be affected by market manipulation, such as pump and dump schemes. Traders should be cautious when interpreting volume data, especially in illiquid markets.
1. On-Balance Volume (OBV): OBV measures buying and selling pressure in the market by adding volume to the OBV when the price increases and subtracting volume when the price decreases.
2. Volume Moving Averages: Volume moving averages help smooth out volume data, making it easier to identify trends and patterns.
Volume indicators can be used in conjunction with chart patterns to confirm trading signals. For example:
Breakouts: A breakout above a resistance level with high volume can confirm a bullish trend.
Reversals: A decrease in volume during a trend may indicate a weakening trend, while an increase in volume during a consolidation phase may indicate a potential breakout.
1. Combine with Other Indicators: Use volume indicators in combination with other technical analysis tools, such as chart patterns and momentum indicators, to confirm trading signals.
2. Monitor Market Conditions: Be aware of market conditions, such as volatility and liquidity, when interpreting volume data.
3. Adjust Trading Strategies: Adjust trading strategies based on volume patterns, such as setting stop-loss orders or adjusting position sizes.